How large is China's GDP and how large is it relative to the USA. The usual answer is that there are two methods of calculating GDP:
(i) GDP at market exchange rates,
(ii) GDP at purchasing power parity
Both of these methods are based on the market value of the goods and services produced. The purchasing power parity method (PPP) adjusts the GDP based on a weighted average of the relative costs of goods and services. However this calculation depends on the weights used and in this respect a change in method will yield significantly different results.
Under the above two methods we have the following data:
(i) GDP US$bn USA 2019 China 2019
21,727 14,140
(ii) PPP US$bn 21,727 27,309
Thus it can be seen that China's GDP almost doubles compared with the USA using the PPP method indicating that prices in China are, on average, half of US prices. But is this realistic?
We will show data to argue that the weightings used in the PPP calculation give a misleading answer and that there exists a body of data which proves that China's economy is in fact much bigger.
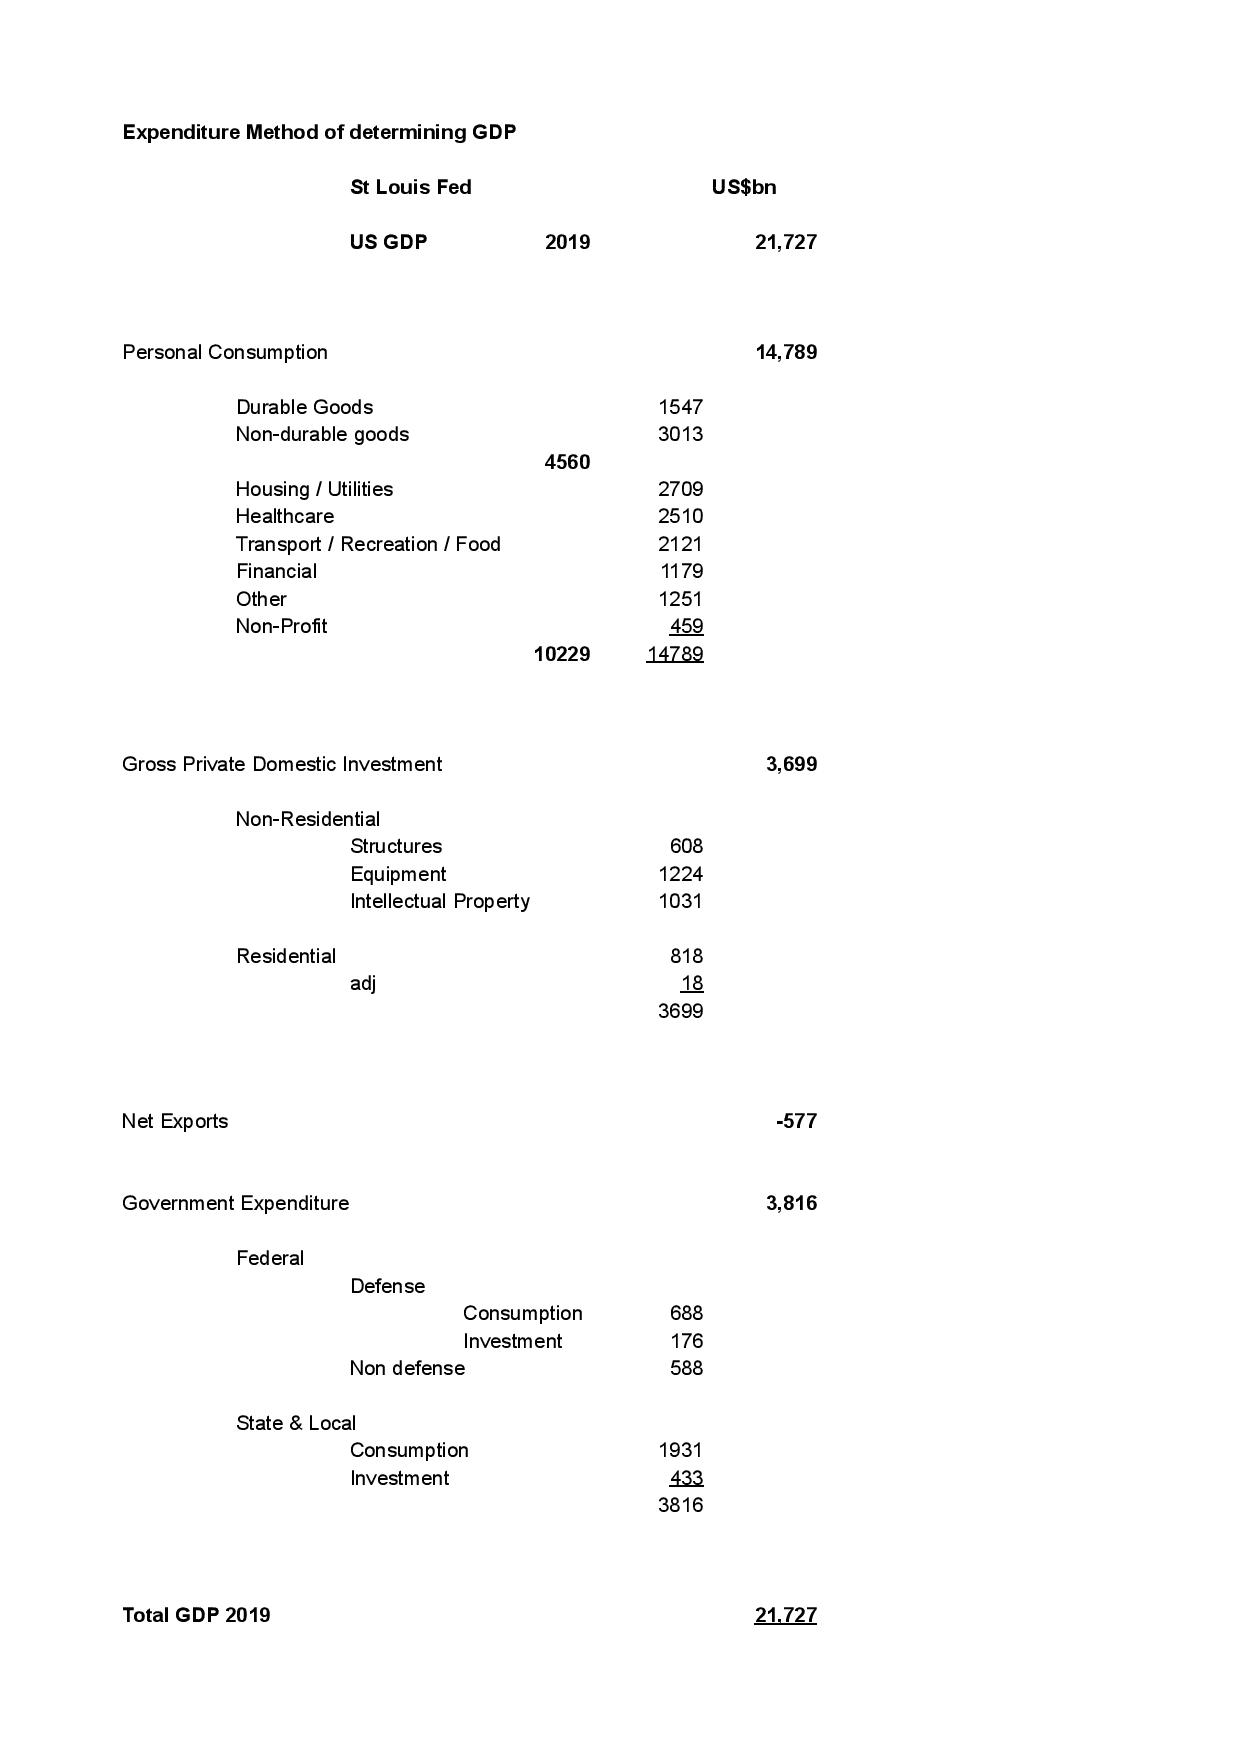
I set out below the US GDP for 2019 using the expenditure format from the St Louis Fed. Now to calculate China's GDP we will make adjustments for
This then gives us our: