All of the China data is from the same source - http://data.stats.gov.cn/english/
However there are several contradictions:
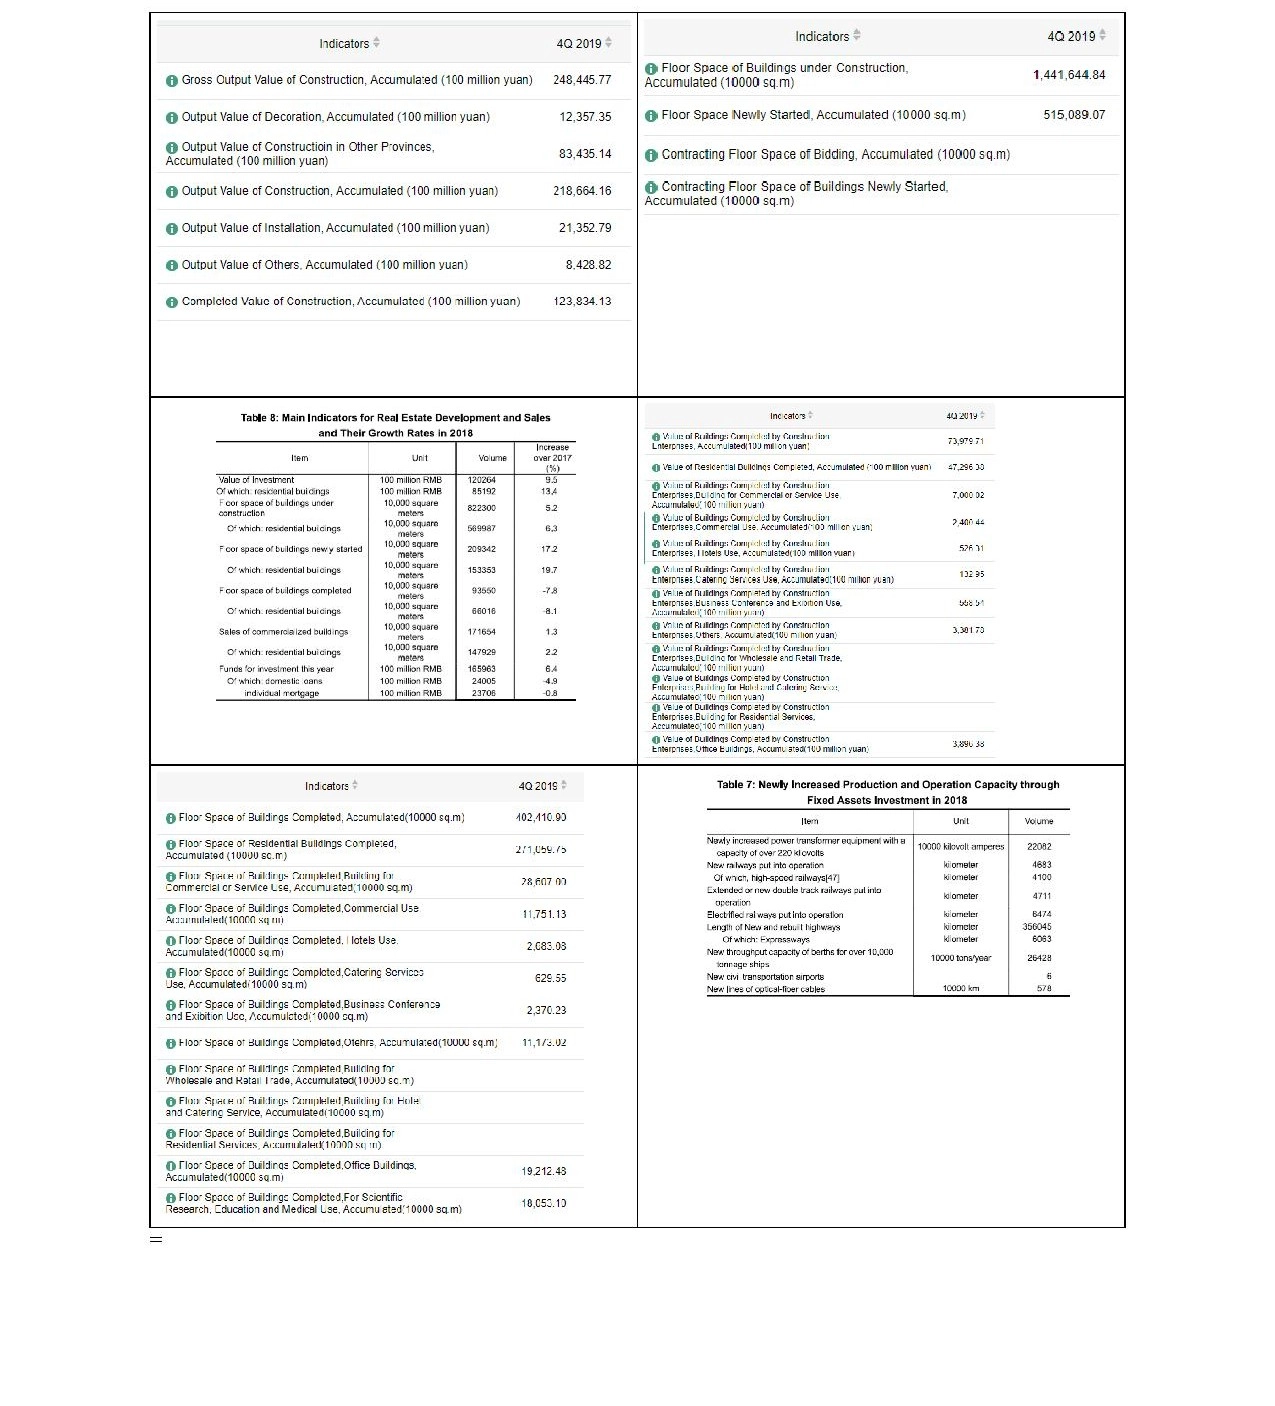
[1] GDP construction for 2017 = Yn 5,568.9bn
GDP for 2017 = Yn 82,482.8bn ==> construction = 6.75% GDP
[2] Floor space under construction (a) 14,416,448,400 m2
(b) 8,223,000,000 m2
[3] Floor space newly started (a) 5,150,890,000 m2
(b) 2,093,420,000 m2
[4] Floor space of buildings completed (a) 4,024,109,000 m2
(b) 935,500,000 m2
[5] Gross output value (a) Yn 24,844,5 bn
(b) Yn 12,026.4 bn
(c) Yn 5,569 bn (official gdp figure)
If we take the higher output value for construction this comes to 27% of GDP in 2019 compared to the official figure of 6.75%; i.e. More than 4 times the officially published value and we get a similar discrepancy in terms of the floor space completed. All of the ancillary evidence points to the higher value:
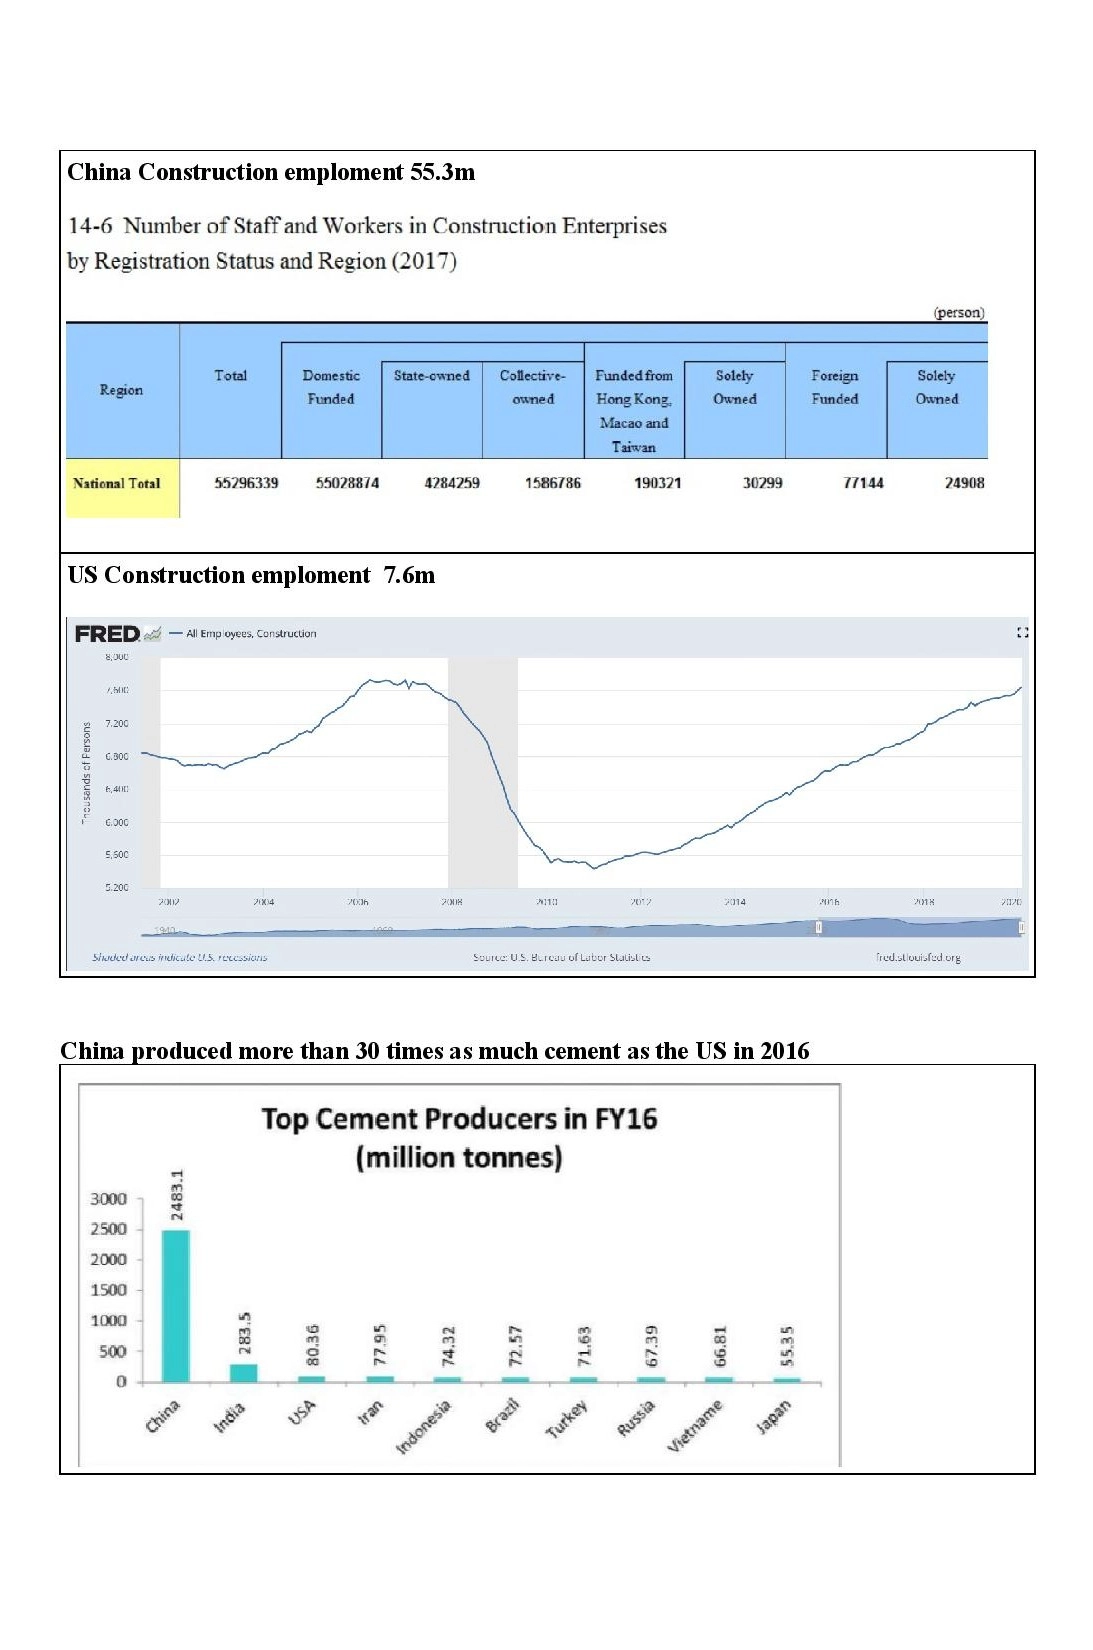
(i) Steel and cement consumption, as well as glass and other commodities.
(ii) Eight times as many work in the sector compared with the US (even though the data may not be comparing like with like) and the anecdotal evidence is that their productivity is higher; i.e. Many high rise buildings are constructed in modular form and then assembled on site which is much quicker than traditional methods.
(iii) China's cities absorb tens of millions of migrants every year and the skylines of cities are constantly changing.